We had a database full of evolution runs. Thousands of them. Each run contained a neural network blueprint, fitness scores, generation counts, and test results. Rich data, but no good way to explore it.
The default view was a raw table dump. Unsorted. Unpaginated. Just 100 rows of data in insertion order. To find a specific run, you’d scroll through the table and hope you spotted it.
Time to build a proper dashboard.
The Requirements
The evolution dashboard needed to handle multiple views:
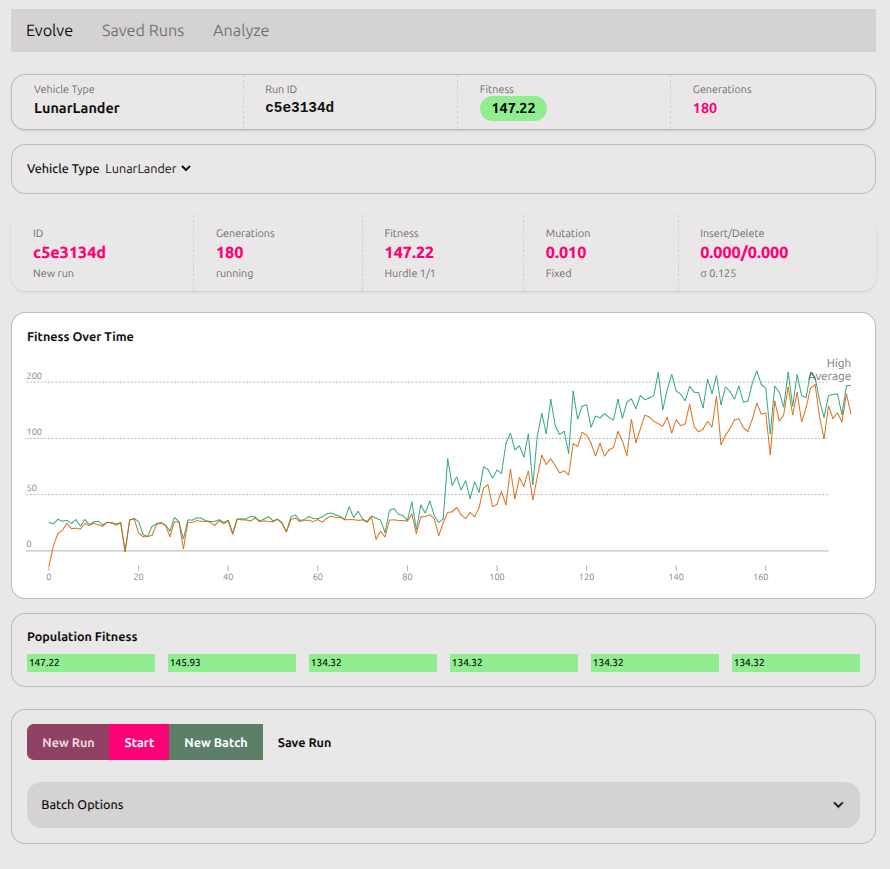
- Active evolution - currently running genetic algorithm
- Saved runs - historical results sorted by date
- Analysis - detailed view of selected run’s performance
- Test management - saved test results for each run
Each view needed different data, different layouts, and different interactions. And it all needed to work together coherently.
The Foundation: Run Context
The first challenge was state management. The dashboard had three tabs, each showing different aspects of the same run. Passing props down through nested components would be unmaintainable.
Svelte 5’s context API was perfect for this:
// runContext.svelte.js
export function createRunContext() {
    let snapshot = $state(null)
    let vehicleType = $state(null)
    let vehiclebps = $state([])

    return {
        get snapshot() { return snapshot },
        get vehicleType() { return vehicleType },
        get vehiclebps() { return vehiclebps },
        // ... methods to update state
    }
}
Now any component in the dashboard could access run data without prop drilling. The context became the single source of truth.
The Saved Runs Table
The raw database dump needed sorting and pagination. I used the @vincjo/datatables library because it handled sorting, filtering, and pagination out of the box.
But there was a problem. The library expected client-side data, and we were fetching from the database. The solution was a two-layer approach:
- Server-side: Fetch last 100 runs sorted by date
- Client-side: Allow re-sorting and filtering within those 100
// +layout.server.js
const runs = await prisma.run.findMany({
    take: 100,
    orderBy: { createdAt: 'desc' },
    include: { tests: true }
})
Then on the client:
const handler = new DataHandler([], { rowsPerPage: 20 })

$effect(() => {
    if (runs.length > 0) {
        handler.setRows(runs)
        handler.sortDesc('createdAt')
    }
})
The $effect was crucial. Without it, Svelte 5’s reactivity wouldn’t track the runs dependency (see my other post about tween reactivity issues).
Now users could:
- See the 20 most recent runs by default
- Navigate through all 100 with pagination
- Sort by ID, type, fitness, or generation count
- Filter by ID or type
- Click a row to view details
The Status Bar
Each run needed a quick summary visible across all tabs. I built a status bar component showing:
- Vehicle type
- Run ID (short form)
- Best fitness
- Generation count
The trick was making it work in two contexts: the live evolution view (with context) and the run detail page (without context). The component needed to be context-optional:
let ctx = null
try {
    ctx = getRunContext()
} catch (e) {
    console.log('No context, using props')
}

// Prefer context, fall back to props
const currentSnapshot = ctx?.snapshot || snapshot
const currentType = ctx?.vehicleType || vehicleType
This pattern let the same component work standalone or within the dashboard context.
The Test Tables
Each run could have multiple test results. These needed their own table with similar sorting/filtering/pagination.
The challenge was caching. When you switch tabs, Svelte destroys and recreates components. Generating test data is expensive (running the network through a full trial). We needed to preserve test data when switching away and back.
Solution: cache tests in the run context.
// In run context
let vehicleTests = new Map()

function getVehicleTest(index) {
    return vehicleTests.get(index)
}

function setVehicleTest(index, testData) {
    vehicleTests.set(index, testData)
}
In the test component:
$effect(() => {
    if (ctx && savedTest.length > 0 && currentTrial) {
        ctx.setVehicleTest(vehicleIndex, {
            test: savedTest,
            trialIndex
        })
    }
})
Now tests persist across tab switches. Generate once, view many times.
The Gotchas
Modal save states: The test save modal needed to auto-save runs that didn’t exist in the database yet. But not all pages had run context. The modal needed the same context-optional pattern as the status bar.
Database IDs vs runtime IDs: Runs loaded from the database had a parentID pointing to the database record. Runs created at runtime generated new UUIDs. The save logic needed to check run.parentID || run.ID to find the right database record.
Reactive data handlers: As mentioned earlier, Svelte 5’s reactivity required initializing DataHandlers with empty data and populating via $effect. Direct initialization captured snapshots instead of reactive references.
The Result
The final dashboard had:
- ✅ Sorted, paginated table of saved runs
- ✅ Status bar showing current run stats
- ✅ Three tabs for evolution/runs/analysis
- ✅ Test management with caching
- ✅ Context-aware components that work standalone or embedded
- ✅ Proper database integration with Prisma
Development time: three days from raw table dump to polished interface.
The key was breaking it into incremental pieces. Build the table. Add pagination. Add the status bar. Add test caching. Each piece worked independently before integrating with the rest.
The Lesson
Dashboard UIs are about managing complexity. You have multiple data sources, multiple views, and multiple interactions. The challenge isn’t making any one piece work - it’s making them work together.
Good state management is 80% of the solution. Get that right, and the components are just views into shared state. Get it wrong, and you’ll spend forever wiring up props and callbacks.
Svelte 5’s context API made this manageable. The run context became the coordination layer, and components became thin wrappers around it.
The other 20%? Handling edge cases. Context-optional components. Database vs runtime IDs. Reactive initialization patterns. The little details that don’t matter until they break production.
Build incrementally. Test each piece. Handle edge cases as you find them.
And use a proper data table library. Don’t roll your own pagination.